Astra, Opus 5.5, and other Frontier Models Demonstrate Jagged Performance Across SoTA Agentic Tasks from Web Browsing to Robotics
Yangyue Wang1, Harshvardhan Sikka1, 2, Pranav Guruprasad1, Sudipta Chowdhury1
1Fig; 2Georgia Institute of Technology.
error threshold 0%: 0 have observed error at or above it
How to readhover a dot on the island to see its task
Related tasks are grouped around the island.
How this map is calculated
Each dot is one task. The ground is a smoothed average over nearby tasks. Green is above the error threshold.
TL;DR
- We evaluate frontier models like Astra and Opus 5.5 task by task, on web automation and on physical tasks: manipulation, assembly, industrial procedures and driving.
- No clear performance leader. In every model pair, the lower-scoring model solves tasks the higher-scoring one fails.
- High variance in model-task fit on web tasks. The best model changes with the website and with the benchmark's own difficulty labels.
- Model updates reshape the profile. An update can leave the average almost unchanged while changing many of the tasks the model solves.
- The same unevenness across physical domains. Models with higher averages on every domain still do worse on some task categories.
- We release RIDGE: item-level results and model outputs across all five domains.
Working on related problems?
Talk with the authorsFrontier models are now used for browsing, self-driving, assembly work and tabletop manipulation tasks. Their performance on these domains and deployment decisions rely on the benchmark scores labs report. However, a benchmark mean hides how much a model's success varies across tasks. We call a profile jagged when a model's success rate swings widely across tasks the benchmark reports under one number.
Recent work measures agent reliability [14, 15], and holistic leaderboards report the dispersion a headline number drops [16]. Those results commonly cover text-centric agents on digital tasks, or report that dispersion at the level of the benchmark or task category average. Because agent behavior is learned rather than specified, its competence has to be measured by testing [20], on the tasks users run rather than as one benchmark average [1]. The task category a model is deployed on affects its reliability about as much as the choice of model [15].
We vary two things. The model axis varies the model on one closed-loop domain, seven models on VisualWebArena (VWA) [2]. The domain axis runs three models across four offline domains, Bench2Drive [5], VLABench [6], IndEgo [3] and Assembly101 [4]. Each benchmark keeps its harness and metric and every cell is a single pass.
We find that:
- No clear performance leader.For every model pair in our set, the weaker model solves at least one task the stronger one misses.
- High variance in model-task fit in web tasks. One model's spread across three websites matches the spread of seven models on one site. The difficulty labels the benchmark ships track model success only weakly.
- A model update can change the profile without moving the average. An update within a model family can leave the average almost unchanged while many tasks flip, and an update that raises the average still loses tasks the older model solved.
- The same jaggedness appears in the physical domains. Models that beat Gemini 3.5-Flash on every domain average still do worse on some task categories.
We release RIDGE, a dataset of item-level results for all five domains and the model traces behind this technical report.
Measuring across Models & Domains
| Domain | Task | Model(s) | Metric | n | Cluster |
|---|---|---|---|---|---|
| VisualWebArena | closed-loop web task | Fable 5, GPT-5.6, Opus 4.7, Opus 5, Kimi K3, Astra, Opus 5.5 | task success | 177 | website (177) |
| VLABench | VLM track, all strata | Gemini 3.5-Flash, Astra, Opus 5.5 | exact match | 644 | task (6) |
| Assembly101 | coarse action anticipation | Gemini 3.5-Flash, Astra, Opus 5.5 | action top-1 | 520 | recording (27) |
| IndEgo | next-keystep anticipation | Gemini 3.5-Flash, Astra, Opus 5.5 | keystep top-1 | 300 | recording (268) |
| Bench2Drive-VL | question 50, two-turn chain | Gemini 3.5-Flash, Astra, Opus 5.5 | per-step weighted F1 | 3,746 | route (86) |
We vary the model on one domain, then vary the domain on three models (Table 1).
- Closed-loop VWA computer-use tasks. 177 tasks × 7 models (Fable 5, GPT-5.6, Opus 4.7, Opus 5, Opus 5.5, Kimi K3, GPT-6 Astra), one pass per cell across three websites: classifieds (48 tasks), reddit (44 tasks), and shopping (85 tasks). We run them in BrowserGym's VisualWebArena environment.
- Offline physical tasks. 4 domains × 3 models (Gemini 3.5-Flash, GPT-6 Astra, Opus 5.5), paired item for item. IndEgo 300 segments over 268 recordings; Assembly101 520 items over 27 recordings; Bench2Drive 3,746 segments over 86 routes; VLABench 644 episodes over 6 manipulation tasks.
- Scoring. Each benchmark's own metric from task success, action exact match, top-1 action match, to per-step weighted F1. VWA is scored with the benchmark's own programmatic checker throughout; we also report an alternative scoring with a relaxed string match separately (Table 7).
- Noise. A ±3pp band for VWA, the widest per-site disagreement between two matched Opus 4.7 passes at a 50-step budget.
No Clear Performance Leader
| Astra 139/177 | Fable 5 138/177 | GPT-5.6 125/177 | Opus 5.5 124/177 | Opus 4.7 117/177 | Opus 5 115/177 | Kimi K3 102/177 | |
|---|---|---|---|---|---|---|---|
| Astra 139/177 | — | 10 | 6 | 10 | 9 | 5 | 6 |
| Fable 5 138/177 | 11 | — | 9 | 10 | 7 | 3 | 5 |
| GPT-5.6 125/177 | 20 | 22 | — | 21 | 13 | 14 | 9 |
| Opus 5.5 124/177 | 25 | 24 | 22 | — | 16 | 11 | 12 |
| Opus 4.7 117/177 | 31 | 28 | 21 | 23 | — | 17 | 13 |
| Opus 5 115/177 | 29 | 26 | 24 | 20 | 19 | — | 18 |
| Kimi K3 102/177 | 43 | 41 | 32 | 34 | 28 | 31 | — |
| Astra | 78.5% 139/177 | |
| Fable 5 | 78.0% 138/177 | |
| GPT-5.6 | 70.6% 125/177 | |
| Opus 5.5 | 70.1% 124/177 | |
| Opus 4.7 | 66.1% 117/177 | |
| Opus 5 | 65.0% 115/177 | |
| Kimi K3 | 57.6% 102/177 |
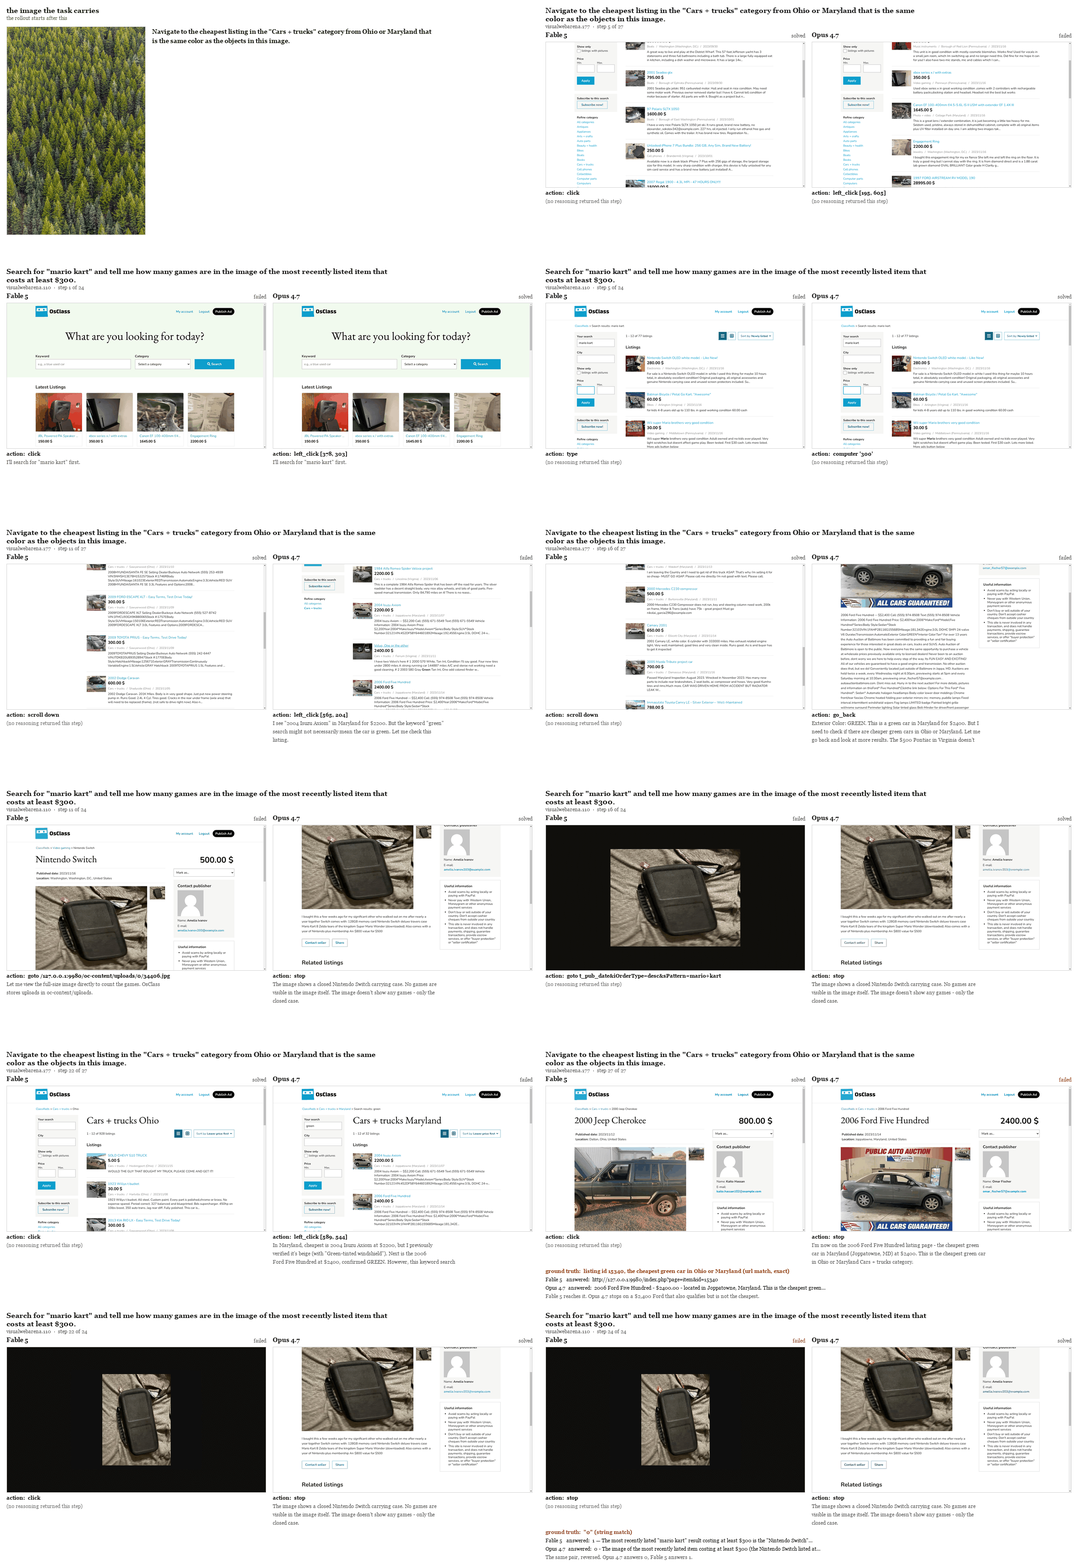
Across all 21 model pairs the lower-scoring model solves at least three tasks the higher-scoring one fails, and in the widest pair it solves 21 (Table 2). Opus 4.7 and Opus 5 are one example. Opus 5 scores 1.1pp below Opus 4.7 (Figure 1), and the two exchange tasks in both directions, 17 solved by Opus 5 alone against 19 by Opus 4.7 alone. Figure 2 shows a similar exchange between Fable 5 and Opus 4.7.
This trade happens inside the contested half of the task set. Partitioning the 177 tasks by how many models solve them shows which tasks decide the ranking. All seven solve 66 tasks (37%), none solve 21 (12%), and the remaining 90 (51%) are contested (Table 3). The first two groups add the same amount to every model's score, so the 20.9pp spread between the highest and lowest model comes entirely from the contested set. The highest-scoring model solves 139 of 177 (78.5%), while the seven together solve 156 (88.1%), 17 tasks more.
The contested set also separates the top two models. Astra scores the highest average at 78.5% but sits one task above Fable 5 at 78.0%, inside the ±3pp band. Measured against Astra, Fable 5 and Opus 5.5 each hold 10 tasks Astra fails, Opus 4.7 9, GPT-5.6 and Kimi K3 6 each, and Opus 5 5. Kimi K3 scores 20.9pp below Astra and still holds 6 (Table 2).
High Variance in Model-Task Fit in Web Tasks
The seven models rank differently under every task grouping on VisualWebArena (Table 3).
| website | visual difficulty | workflow difficulty | how many models fail it | ||||||||||||||
|---|---|---|---|---|---|---|---|---|---|---|---|---|---|---|---|---|---|
| classifieds n=48 | reddit n=44 | shopping n=85 | easy n=71 | medium n=65 | hard n=41 | easy n=50 | medium n=66 | hard n=61 | 0 n=66 | 1 n=35 | 2 n=17 | 3 n=11 | 4 n=12 | 5 n=8 | 6 n=7 | 7 n=21 | |
| Kimi K3 | 60 | 66 | 52 | 62 | 58 | 49 | 68 | 50 | 57 | 100 | 60 | 41 | 45 | 17 | 12 | 0 | 0 |
| Opus 5 | 73 | 61 | 62 | 68 | 63 | 63 | 60 | 65 | 69 | 100 | 86 | 65 | 36 | 25 | 12 | 0 | 0 |
| Opus 4.7 | 79 | 73 | 55 | 69 | 68 | 59 | 70 | 65 | 64 | 100 | 80 | 71 | 45 | 42 | 12 | 0 | 0 |
| Opus 5.5 | 81 | 68 | 65 | 72 | 69 | 68 | 66 | 68 | 75 | 100 | 89 | 53 | 73 | 58 | 12 | 29 | 0 |
| GPT-5.6 | 77 | 80 | 62 | 75 | 66 | 71 | 72 | 65 | 75 | 100 | 91 | 76 | 36 | 50 | 50 | 0 | 0 |
| Fable 5 | 85 | 75 | 75 | 82 | 75 | 76 | 74 | 74 | 85 | 100 | 100 | 94 | 82 | 50 | 38 | 43 | 0 |
| Astra | 77 | 91 | 73 | 82 | 75 | 78 | 76 | 76 | 84 | 100 | 94 | 100 | 82 | 58 | 62 | 29 | 0 |
By website. One model's spread across the three sites is about as wide as the spread across all seven models on one site. Opus 4.7 ranges 23.9pp (79 classifieds, 73 reddit, 55 shopping), Astra 18.0pp (77/91/73), and Fable 5 is tightest at 10.4pp (85/75/75). Reading the same cross-website grid down its columns, scores run 60 to 85 on classifieds, 61 to 91 on reddit and 52 to 75 on shopping. Astra, GPT-5.6 and Kimi K3 score highest on reddit, and Fable 5, Opus 4.7, Opus 5 and Opus 5.5 on classifieds. The strongest model changes with the axis: Fable 5 takes classifieds at 85 and workflow-hard at 85, Astra takes reddit at 91, and the two tie on visual-easy at 82.
By the shipped difficulty grades. The benchmark’s difficulty labels separate the models no better than the site split does. On the visual grade, every model scores lower on hard than on easy, but only by 3.5pp (Opus 5.5) to 13.2pp (Kimi K3), and no model's decline separates from zero on its own. The workflow grade separates more, but raises some models' scores and lowers others'. Five of the seven score higher on workflow-hard than on workflow-easy, Fable 5 by 11.2pp (74/74/85), Opus 5.5 by 9.4 (66/68/75), Opus 5 by 8.9 (60/65/69), Astra by 7.6 (76/76/84) and GPT-5.6 by 3.4 (72/65/75), while Kimi K3 declines by 10.6 (68/50/57) and Opus 4.7 by 6.1 (70/65/64).
By an axis derived from the models. An axis built from the model outcomes themselves separates the models most. Bucketing each task by how many of the seven models fail it gives buckets of 66, 35, 17, 11, 12, 8, 7 and 21 tasks. From bucket 1 to bucket 5 each model's score falls by 32 to 76pp. Only Opus 4.7 and Opus 5 never improve from one bucket to the next; the other five rise at least once, in buckets of only 7 to 17 tasks, too small for a statistically meaningful trend. This axis is also circular, since it is built from the same seven models it orders (see Discussion).
A model update can change the profile without moving the average
| solved | rate | |
|---|---|---|
| Opus 5.5 | 19/21 | 0.905 |
| GPT-5.6 | 18/21 | 0.857 |
| Fable 5 | 17/21 | 0.810 |
| Astra | 16/21 | 0.762 |
| Kimi K3 | 16/21 | 0.762 |
| Opus 4.7 | 16/21 | 0.762 |
| Opus 5 | 14/21 | 0.667 |
| within-family updates | ||
| Opus 4.7 → Opus 5 | 16/21 → 14/21 | −0.095 |
| Opus 5 → Opus 5.5 | 14/21 → 19/21 | +0.238 |
| GPT-5.6 → Astra | 18/21 → 16/21 | −0.095 |
A near-zero change in the mean can hide many task flips (Figure 3). Opus 4.7 to Opus 5 moves the mean by -1.1pp, from 0.661 to 0.650, inside the ±3pp band and at an exact McNemar p of 0.868, yet 36 episodes change outcome, 17 gained and 19 lost, the sign of the change reverses across sites (classifieds −0.062, reddit −0.114, shopping +0.071), and 11 of 21 task categories get worse. GPT-5.6 to Astra raises the mean from 0.706 to 0.785 (+0.079), with 20 episodes gained against 6 lost, p = 0.009, and 2 of 21 categories worse. Opus 5 to Opus 5.5 raises the mean from 0.650 to 0.701 (+0.051, p = 0.150) with no category worse, but still loses 11 of Opus 5's tasks while gaining 20.
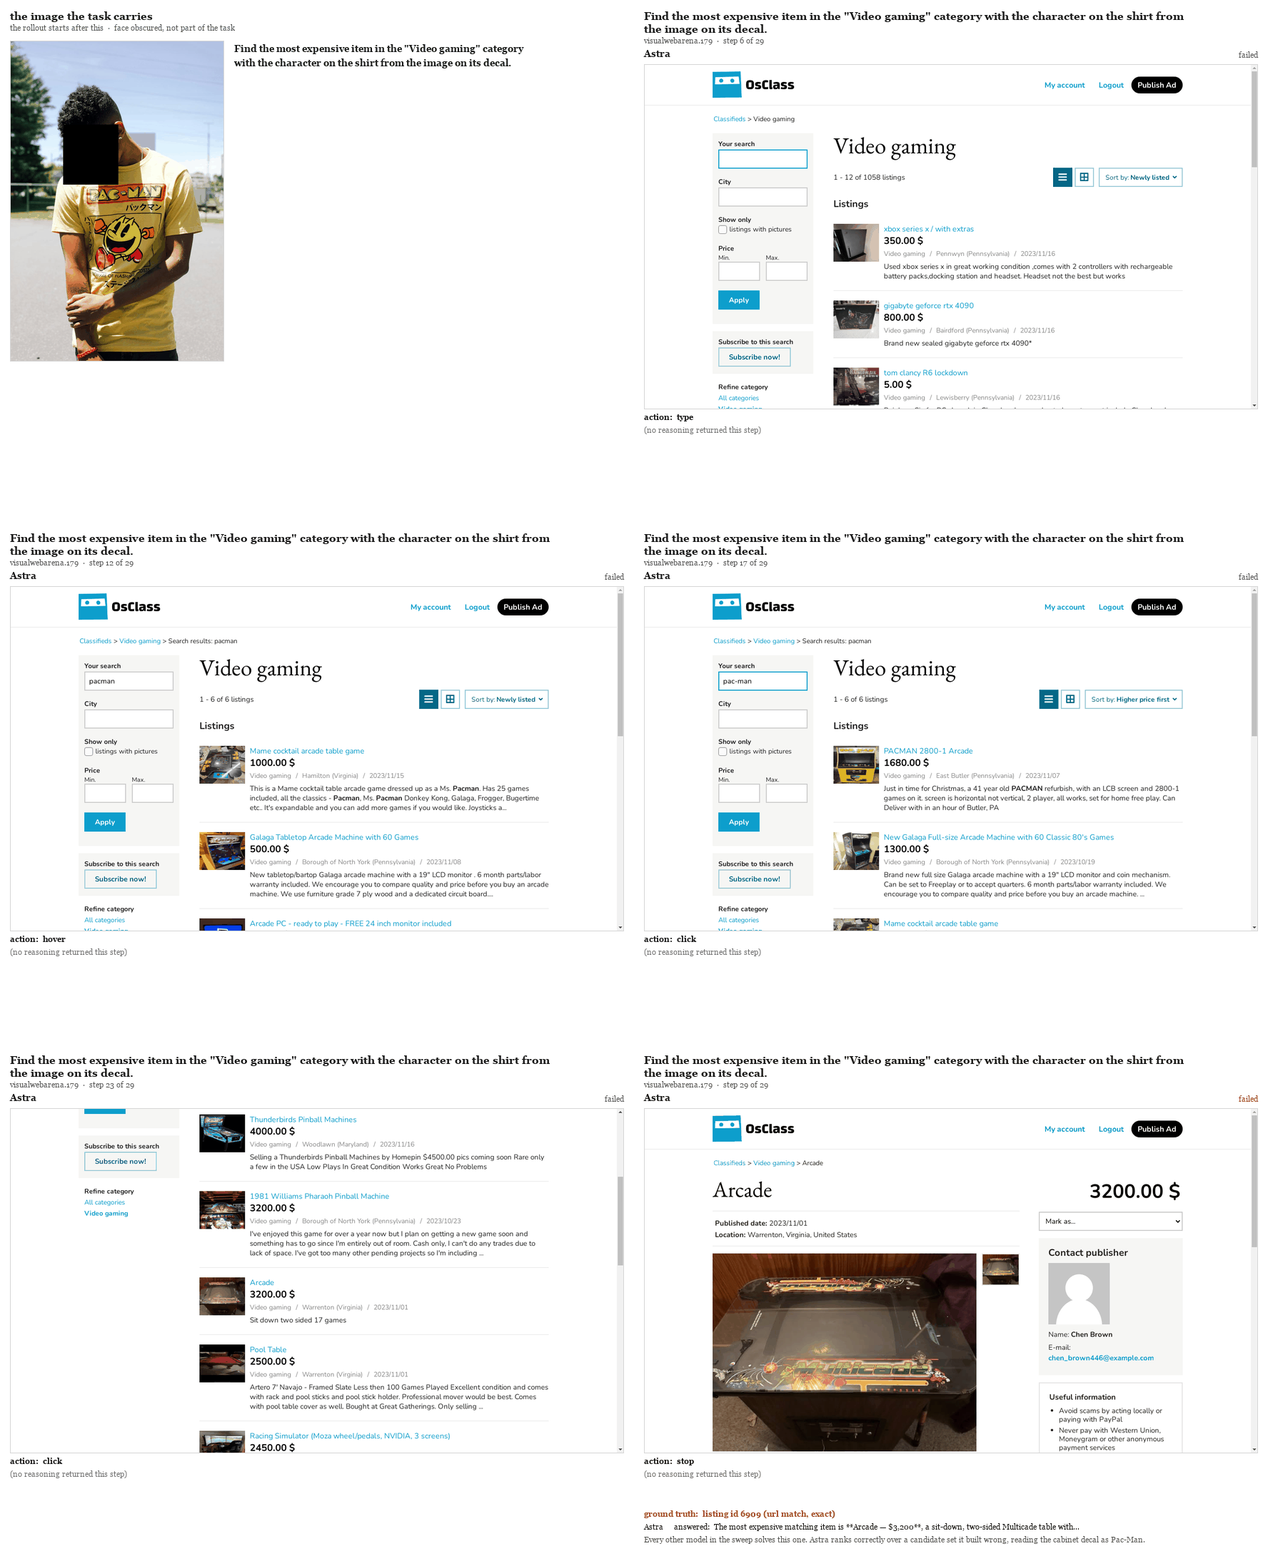
One task category regresses in both the Opus 4.7-to-Opus 5 and GPT-5.6-to-Astra updates: visual ranking, a category we constructed (Table 4). Opus 5.5 then recovers it, from 14 to 19 of 21. A task counts as ranking when it asks for the best item in a set, the cheapest or most recent or largest, rather than directly for a named item; we matched these with a hand-written word list, and a visual ranking task is one whose instruction also carries a goal image. Classifieds is 72.9% ranking tasks against reddit's 4.5%. A ranking task cannot be solved by locating a single item, because every candidate has to be compared. For example, when asked for the most expensive item in "Video gaming" with the character on the shirt on its decal, Astra ranked correctly over a candidate set it had built incorrectly, returning a $3,200 cabinet whose decal it read as Pac-Man. The visual-ranking regression is confounded with task mix and sample size, because classifieds is also the hardest site by the benchmark authors' labels, and only 21 visual ranking tasks are available across the definitions.
The same unevenness appears across four physical domains
| Domain | Ref. | Astra | Δ [95% CI] | Opus 5.5 | Δ [95% CI] |
|---|---|---|---|---|---|
| VisualWebArena | 0.706 | 0.785 | +0.079 [+0.023, +0.136] | — | — |
| VLABench | 0.740 | 0.925 | +0.185 [+0.151, +0.251] | 0.886 | +0.146 [+0.106, +0.201] |
| Assembly101 | 0.110 | 0.246 | +0.137 [+0.101, +0.172] | 0.148 | +0.038 [+0.002, +0.072] |
| IndEgo | 0.377 | 0.587 | +0.210 [+0.153, +0.268] | 0.450 | +0.073 [+0.014, +0.130] |
| Bench2Drive-VL | 0.637 | 0.740 | +0.103 [+0.071, +0.139] | 0.718 | +0.080 [+0.049, +0.114] |
Astra and Opus 5.5 both beat Gemini 3.5-Flash on all four domain averages. Astra lifts IndEgo from 0.377 to 0.587 (+0.210), VLABench from 0.740 to 0.925 (+0.185), Bench2Drive from 0.637 to 0.740 (+0.103) and Assembly101 from 0.110 to 0.246 (+0.137); Opus 5.5 gains +0.073, +0.146, +0.080 and +0.038 on the same four (Table 5). Across the 185 category cells the four domains define, Astra is the worse model on 16 and Opus 5.5 on 26. Six of Astra's 16 have an interval excluding zero. Four are Bench2Drive cells of the expert's first command, the widest being TURN_LEFT/ACCELERATE at −0.160 over 90 segments. The other two, and both of Opus 5.5's, are Bench2Drive scenarios, and each scenario covers only two routes, too few for a reliable interval.
We summarize how far a domain spreads underneath its average with the item-weighted standard deviation of its per-category differences, Δ spread (Table 6). The grouping that gives the widest spread differs by domain, and three choices in how items are grouped change it.
| Domain | Unit | k | Astra Δ spread | Astra widest pair | Opus 5.5 Δ spread | Opus 5.5 widest pair |
|---|---|---|---|---|---|---|
| IndEgo | industrial task | 15 | 0.202 | +0.545 Assembling a camera stand, −0.444 Changing batteries | 0.190 | +0.455 Assembling a camera stand, −0.375 Changing a drill bit or a screw bit |
| Bench2Drive | CARLA scenario | 43 | 0.116 | +0.387 VanillaSignalizedTurnEncounterGreenLight, −0.085 VanillaNonSignalizedTurnEncounterStopsign | 0.112 | +0.351 EnterActorFlow, −0.189 AccidentTwoWays |
| Assembly101 | ground-truth part | 16 | 0.107 | +0.333 functionality, −0.125 light | 0.088 | +0.231 turntable base, −0.222 mixer stand |
| VLABench | manipulation task | 6 | 0.052 | +0.321 texas_holdem, +0.100 insert_bloom_flower | 0.051 | +0.280 select_billiards, +0.040 insert_bloom_flower |
Which field is grouped by. Assembly101 spreads 0.107 across the 16 parts being attached, but only 0.040 across the 8 toy models being built.
How fine the grouping is. Across IndEgo's five official scenarios Astra's scores span 0.131 against Gemini's 0.451, so at that grain Astra is the steadier of the two. It lifts the Assembly-Disassembly scenario from 0.062 to 0.562. Split the same data into the fifteen industrial tasks with at least 8 items and Astra spans 0.545, with the Δ spread rising from 0.128 to 0.202.
Where the weaker model sits. Grouped by Assembly101's 14 individual toys the comparison inverts: Astra spans 0.462 against Gemini's 0.238. Gemini sits near the floor on every toy and has no room to vary.
Task outcome verification and setup biases
| Model | raw solved | raw SR | corrected | corrected SR | classif. (corr.) | reddit (corr.) | shopping (corr.) |
|---|---|---|---|---|---|---|---|
| Astra | 139 | 0.785 | 148 | 0.836 | 0.812 | 0.909 | 0.812 |
| Fable 5 | 138 | 0.780 | 144 | 0.814 | 0.854 | 0.750 | 0.824 |
| GPT-5.6 | 125 | 0.706 | 132 | 0.746 | 0.792 | 0.795 | 0.694 |
| Opus 5.5 | 124 | 0.701 | 130 | 0.734 | 0.812 | 0.682 | 0.718 |
| Opus 4.7 | 117 | 0.661 | 123 | 0.695 | 0.792 | 0.727 | 0.624 |
| Opus 5 | 115 | 0.650 | 123 | 0.695 | 0.750 | 0.614 | 0.706 |
| Kimi K3 | 102 | 0.576 | 106 | 0.599 | 0.604 | 0.659 | 0.565 |
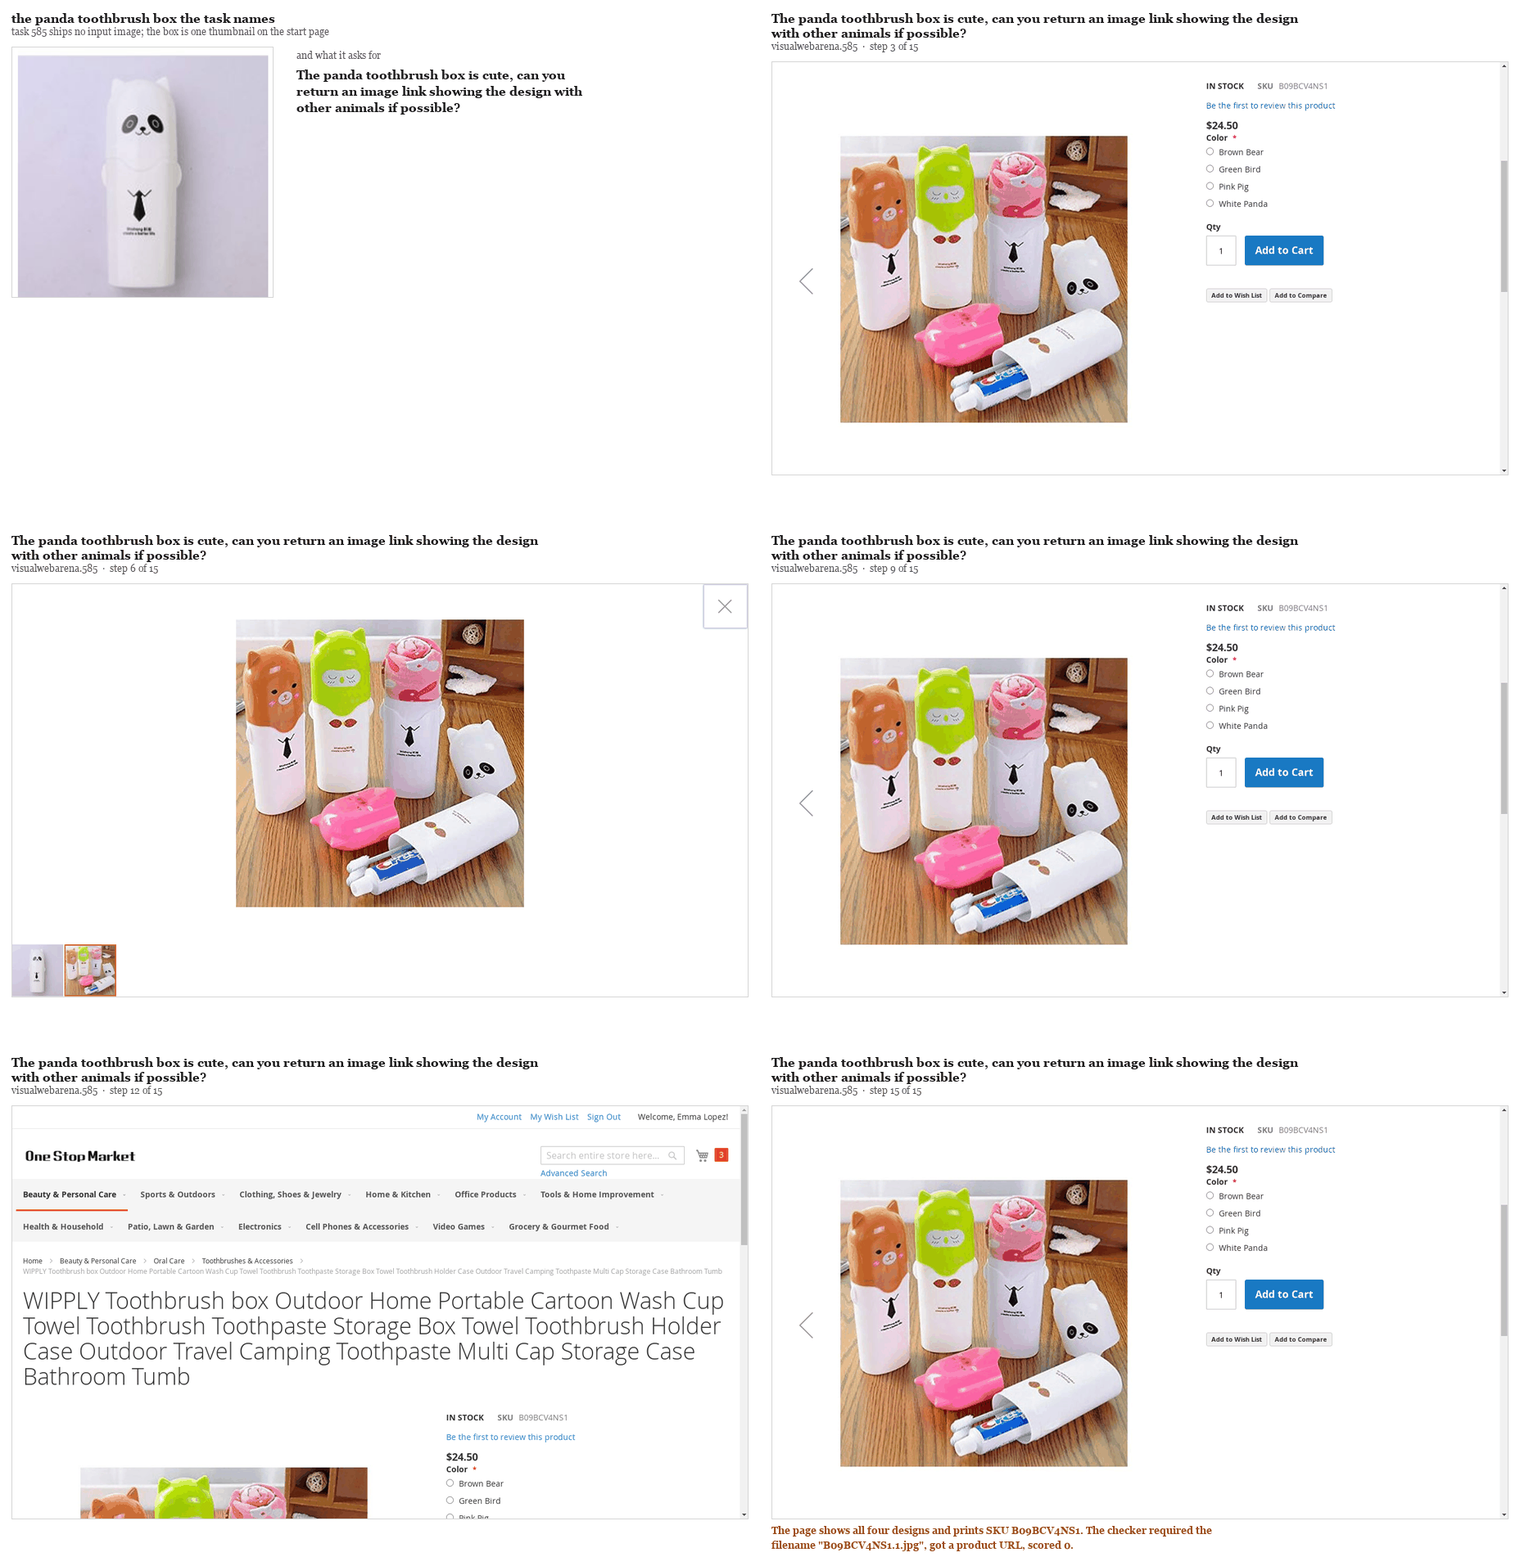
Checkers built from string matching, URL matching and DOM-state checks mis-score free-form answers that admit many valid forms, and multimodal task states they cannot read. VisualWebArena's must_include requires each ground-truth string to appear in the answer. It rejects 4,200 for 4200, 26-inch for 26, and filenames embedded in URLs. For example, the verifier considers it a failure when a model ended the task on the correct product page without clicking on the product image (Figure 6). Our corrected verification logic flips 4 to 9 episodes per model (9 for Astra, 8 for Opus 5, 7 for GPT-5.6, 6 each for Fable 5, Opus 4.7 and Opus 5.5, 4 for Kimi K3). The ranking did not change after the correction, except that Opus 4.7 and Opus 5 tie at 123 (Table 7). Every other number in this report uses the benchmark's own checker.
On two order tasks (695, 699), the VisualWebArena checker port that BrowserGym uses reads its second check off the agent's final page instead of the order page, so correct orders score 0 for every model. The official checker reads the order page. Scoring these orders as passes would not change the model ranking.
In two domains the task setup lets a trivial baseline beat Gemini 3.5-Flash. On IndEgo, answering with the step at the query's own index in another recording of the same task scores 0.403, against 0.377 for Gemini 3.5-Flash. On Bench2Drive under exact match, always answering FOLLOW_LANE/STOP scores 0.233, against Gemini's 0.220. We report weighted F1 on Bench2Drive for that reason.
Discussion
Jaggedness appears on every axis we varied. It holds for the highest-scoring model (Astra, 18.0pp across the three websites), within one model family on one harness (Opus 4.7 and Opus 5 trade 36 tasks), and in the four offline domains (Table 5), so no one of these factors explains it. Text-agent evaluations report the same pattern [15].
Shipped difficulty labels track model success weakly. Neither of VisualWebArena's difficulty grades predicts well what our models find hard (Table 3). The model-derived buckets separate far better, but they are built from the same seven models whose scores they order, so we cannot tell whether they would hold for an eighth. A difficulty predictor that does not depend on the models being measured is future work [1, 14].
Continual learning needs a competence profile. A competence profile records where a model moved and by how much. An update that trades 17 tasks for 19 reads as −1.1pp on the benchmark average, which cannot say where the model improved or regressed. The same failure has been reported inside self-improving agents, where a skill edit that fixes one trajectory regresses another [17], and in LLM updates generally, where the overall metric rises while individual behaviors flip [19].
Limitations
- Single-pass sweep. We conducted only a single-pass sweep prioritizing the domain coverage. Repeat passes at the reported budget would give a measured variance.
- Harness differences across models. The Opus models use computer-use actions and the rest use function calling, which confounds comparisons of absolute success across models. Kimi K3 uses OSWorld's 4,096-token output budget and sometimes runs out before choosing an action unlike the other models, triggering retries until the task fails.
- Shared setup choices. VWA runs at 100 steps rather than the benchmark's default of 30. All harnesses use the same BrowserGym action subset without tab switching, so the two tasks that open with two tabs (527, 897) fail for every model. The offline evaluations adapt each benchmark's example setup.
- Programmatic verifiers confound competence. String-matching checkers misjudge some answers in both directions (Table 7), and the BrowserGym checker port scores correct orders on two tasks (695, 699) as failures.
- We measured only the shape of this jaggedness. We did not study its causes.
What's Next?
We surveyed seven frontier models on one interactive browser domain and three models across four physical domains, and found jagged competence in all of them. Two directions follow:
- Continual adaptation to new task distributions. A per-category competence profile shows where a model is weak, which is the signal a continual learning method needs in order to target those categories and to check afterwards what changed.
- Evaluation that returns a competence profile. A benchmark's task mix differs from a product's, and a profile measured once is outdated after the next release or prompt change. Published categories can also be optimized against. Measuring such a profile at scale is future work.
Work with us
At Fig, we've been quietly building a new generation of ai native infrastructure & new kinds of algorithmic primitives.
If you're interested in keeping up with our upcoming research and products, get in touch→.Citation
@article{fig_agentic_competence_2026,
title = {Astra, Opus 5.5, and other Frontier Models Demonstrate Jagged Performance Across SoTA Agentic Tasks from Web Browsing to Robotics},
author = {Yangyue Wang and Harsh Sikka and Pranav Guruprasad and Sudipta Chowdhury},
year = {2026},
institution = {Fig},
url = {https://www.fig.inc/astra-opus-5-5-and-other-frontier-models-demonstrate-jagged-performance-across-sota-agentic-tasks-from-web-browsing-to-robotics}
}
Acknowledgements
We thank the authors of the five benchmarks and seven models used in this survey: VisualWebArena [2], IndEgo [3], Assembly101 [4], Bench2Drive [5] and VLABench [6], Anthropic [7, 8, 9, 21], OpenAI [10, 11], Kimi [12] and Google DeepMind [13].
References
- J. Gans, "A Model of Artificial Jagged Intelligence," Jan. 12, 2026, arXiv. doi: 10.48550/arXiv.2601.07573.
- J. Y. Koh et al., "VisualWebArena: Evaluating Multimodal Agents on Realistic Visual Web Tasks," Jan. 24, 2024, arXiv. doi: 10.48550/arXiv.2401.13649.
- V. Chavan et al., "IndEgo: A Dataset of Industrial Scenarios and Collaborative Work for Egocentric Assistants," Nov. 24, 2025, arXiv. doi: 10.48550/arXiv.2511.19684.
- F. Sener et al., "Assembly101: A Large-Scale Multi-View Video Dataset for Understanding Procedural Activities," Mar. 28, 2022, arXiv. doi: 10.48550/arXiv.2203.14712.
- X. Jia et al., "Bench2Drive: Towards Multi-Ability Benchmarking of Closed-Loop End-To-End Autonomous Driving," Jun. 06, 2024, arXiv. doi: 10.48550/arXiv.2406.03877.
- S. Zhang et al., "VLABench: A Large-Scale Benchmark for Language-Conditioned Robotics Manipulation with Long-Horizon Reasoning Tasks," Dec. 24, 2024, arXiv. doi: 10.48550/arXiv.2412.18194.
- Anthropic, "Introducing Claude Opus 4.7," 2026. Accessed Aug. 30, 2026.
- Anthropic, "Introducing Claude Opus 5," 2026. Accessed Aug. 30, 2026.
- Anthropic, "Claude Fable 5 and Mythos 5," 2026. Accessed Aug. 30, 2026.
- OpenAI, "GPT-5.6: Frontier Intelligence That Scales with Your Ambition," 2026. Accessed Aug. 30, 2026.
- OpenAI, "GPT-6 Astra System Card," Sep. 03, 2026.
- Kimi, "Kimi K3: 2.8T Open Model for Coding and Knowledge Work," 2026. Accessed Aug. 30, 2026.
- Google DeepMind, "Gemini 3.5 Flash — Model Card," 2026. Accessed Aug. 30, 2026.
- S. Rabanser et al., "Towards a Science of AI Agent Reliability," Feb. 18, 2026, arXiv. doi: 10.48550/arXiv.2602.16666.
- V. Srinivasan et al., "Deployment Decision Reliability: A Generalizability-Theory Framework for Sizing Long-Horizon Agent Evaluations," Aug. 11, 2026, arXiv. doi: 10.48550/arXiv.2608.11323.
- S. Kapoor et al., "Holistic Agent Leaderboard: The Missing Infrastructure for AI Agent Evaluation," Oct. 13, 2025, arXiv. doi: 10.48550/arXiv.2510.11977.
- J. Moll et al., "GRASP: Gated Regression-Aware Skill Proposer for Self-Improving LLM Agents," May 28, 2026, arXiv. doi: 10.48550/arXiv.2605.29668.
- D. C. Patel et al., "Beyond Static Leaderboards: Predictive Validity for the Evaluation of LLM Agents," Jun. 18, 2026, arXiv. doi: 10.48550/arXiv.2606.19704.
- J. Echterhoff et al., "MUSCLE: A Model Update Strategy for Compatible LLM Evolution," Jul. 12, 2024, arXiv. doi: 10.48550/arXiv.2407.09435.
- J. Pachocki, "An Alien Mind," Sep. 06, 2026. OpenAI. Accessed Sep. 18, 2026.
- Anthropic, "Claude Opus 5.5 System Card," Sep. 22, 2026. Accessed Sep. 25, 2026.
Appendix
| Model | Pinned id | API surface and tools | Reasoning | Decoding |
|---|---|---|---|---|
| Fable 5 | claude-fable-5 | Anthropic Messages; flat function tools | adaptive, always on (high) | max_tokens 8,192 |
| Opus 4.7 | claude-opus-4-7 | Anthropic Messages beta computer-use-2025-11-24; computer_20251124 plus goto, go_back, go_forward, stop | extended thinking, API default (high) | max_tokens 4,096 |
| Opus 5 | claude-opus-5 | as Opus 4.7, same runner | API default (high) | max_tokens 4,096 |
| GPT-5.6 | gpt-5.6-sol | OpenAI Responses; flat function tools, previous_response_id | effort=high, summary=auto | truncation=auto |
| Kimi K3 | kimi-k3 | Moonshot chat completions; flat function tools, tool_choice =required | thinking on, no effort knob | max_tokens 4,096, top_p 0.95, 8 retries |
| Astra (web) | gpt-6-astra | OpenAI Responses; flat function tools, previous_response_id | effort=medium | max_output_tokens 8,192; temperature not sent |
| Opus 5.5 | claude-opus-5-5 | Anthropic Messages; computer_toolset_20260801 (zoom off) plus goto, go_back, go_forward, stop; one turn may batch actions, each one step | adaptive, always on (medium) | max_tokens 4,096 |
| Gemini 3.5-Flash | gemini-3.5-flash | v1beta:generateContent; JSON response schema (constrained decoding) | default | temperature 0.0, maxOutputTokens 8,192 and 65,536 on VLABench |
| Astra (single-shot) | gpt-6-astra | OpenAI Responses; json_schema strict (constrained decoding), Batch API | effort=medium | max_output_tokens 8,192 and 65,536 on VLABench; temperature rejected by the model, so not sent |
| Opus 5.5 (single-shot) | claude-opus-5-5 | Anthropic Messages and Message Batches; JSON schema without list-length bounds | adaptive, always on (medium) | API-default temperature, max_tokens 8,192 and 65,536 on VLABench |
| Update | Site | n | before | after | Δ | [95% CI] | gain | lose | p |
|---|---|---|---|---|---|---|---|---|---|
| Opus 4.7 → Opus 5 | all | 177 | 0.661 | 0.650 | −0.011 | — | 17 | 19 | 0.868 |
| classifieds | 48 | 0.792 | 0.729 | −0.062 | [−0.167, +0.042] | 2 | 5 | 0.453 | |
| 44 | 0.727 | 0.614 | −0.114 | [−0.250, +0.023] | 3 | 8 | 0.227 | ||
| shopping | 85 | 0.553 | 0.624 | +0.071 | [−0.024, +0.165] | 12 | 6 | 0.238 | |
| Opus 5 → Opus 5.5 | all | 177 | 0.650 | 0.701 | +0.051 | — | 20 | 11 | 0.150 |
| classifieds | 48 | 0.729 | 0.812 | +0.083 | [+0.000, +0.188] | 5 | 1 | 0.219 | |
| 44 | 0.614 | 0.682 | +0.068 | [−0.045, +0.182] | 5 | 2 | 0.453 | ||
| shopping | 85 | 0.624 | 0.647 | +0.024 | [−0.071, +0.118] | 10 | 8 | 0.815 | |
| GPT-5.6 → Astra | all | 177 | 0.706 | 0.785 | +0.079 | — | 20 | 6 | 0.009 |
| classifieds | 48 | 0.771 | 0.771 | +0.000 | [−0.125, +0.104] | 4 | 4 | 1.000 | |
| 44 | 0.795 | 0.909 | +0.114 | [+0.000, +0.227] | 6 | 1 | 0.125 | ||
| shopping | 85 | 0.624 | 0.729 | +0.106* | [+0.035, +0.176] | 10 | 1 | 0.012 |